Data Analysis / Metrics

Data Analysis / Metrics

Data-analysis platforms turn operational and instructional information into understandable measures that leaders can use to monitor priorities and outcomes.

Strong implementations combine trustworthy definitions, appropriate comparisons, disaggregation, secure role-based access, and context so dashboards inform inquiry and action rather than merely displaying numbers.

What these systems support

  • Dashboards, key performance indicators, trends, and benchmarks
  • Cohort, subgroup, program, and resource analysis
  • Goals, alerts, narrative context, and improvement-cycle monitoring

Note: SDLA does not endorse or resell any of the systems listed on this site.


21 results - showing 1 - 20
1 2
Details

Product Details

Overview

Acadience Data Management is the legacy data-entry and reporting service for Acadience literacy and mathematics assessments. Acadience Learning is moving customers and historical records into Acadience Learning Online (ALO), the current platform for digital or manual assessment administration, immediate scoring, dashboards, progress monitoring, goal setting, and reports.

This is a focused assessment data system rather than a districtwide analytics warehouse. It helps educators identify students at risk in foundational reading or mathematics, review benchmark and progress-monitoring results, evaluate instructional support, create groups, and report from student through district levels.

Product Details

Overview

Aeries Analytics is the reporting, dashboard, and early-warning component built into the Aeries student information system. It turns current SIS information—including attendance, grades, discipline, assessments, program participation, interventions, graduation progress, and California college-and-career indicators—into configurable charts, student groups, and watchlists.

Because the analytics operate directly on Aeries data, districts do not need to build a separate warehouse or routine export for the supported indicators. Teachers and administrators can move from a district or school dashboard to the individual students behind a result, then create groups or record interventions using the same operational student record.

Product Details

Overview

BrightBytes Clarity is an education analytics platform organized around research-based frameworks. Districts use surveys and connected operational or outcome data to examine areas such as technology implementation, digital learning conditions, school improvement, student success, and organizational readiness, with dashboards that compare results across schools and groups.

The platform's distinguishing approach is to pair collected evidence with benchmarks and recommended actions rather than provide open-ended business intelligence alone. BrightBytes was acquired by Google, but current public product and support information is limited; districts should verify the current contracting entity, available modules, and roadmap before treating this listing as an actively marketed standalone platform.

Measuring Academic Growth_CORE

Product Details

Overview

CORE Districts' Data Collaborative is a California district membership and research partnership supported by the CORE360 data system. It gives participating districts dashboards and reports that go beyond the California School Dashboard by combining academic growth, postsecondary on-track indicators, school culture and climate, social-emotional learning, and equity measures.

CORE is not simply a software vendor. Members contribute to shared metric development, benchmarking, research with Policy Analysis for California Education, and practitioner learning across more than 100 districts. The technology is one part of a broader continuous-improvement network.

Product Details

Overview

DataZone is a county-office-managed student data warehouse and analytics service developed by the Santa Clara County Office of Education for California districts. It centralizes SIS, assessment, attendance, grade, behavior, program, state, and partner data so educators can use ready-made dashboards, self-service reports, early-warning tools, and cross-agency applications without maintaining local warehouse infrastructure.

The current service portfolio extends beyond dashboards to MTSS intervention tracking, CALPADS validation, social-emotional surveys, secure partner data exchanges, foster-youth support, and community-service referrals. Shared governance, standard definitions, county support, and interagency agreements are central to the model.

DecisionEd - Introduction

Product Details

Overview

DecisionEd is a K–12 data warehouse, dashboard, reporting, and early-warning platform. It links information from SIS, assessment, attendance, behavior, intervention, finance, HR, and other systems so educators and administrators can analyze students, programs, curriculum, staff, schools, and district operations from a shared source.

The platform is designed to deliver information through dashboards, reports, alerts, email, and advanced analytics instead of leaving analysts to assemble recurring spreadsheets. Its whole-student early-warning models can combine multiple measures and provide role-specific views for data teams, PLCs, counselors, teachers, and leaders.

EduClimber in MMSD

Product Details

Overview
Renaissance eduCLIMBER is a whole-child data and MTSS management platform. It brings academic, assessment, behavior, attendance, social-emotional, and intervention information together so school teams can identify needs, plan supports, monitor progress, and evaluate whether interventions are working.
Interactive dashboards, student profiles, meeting tools, action items, plans, and effectiveness reports help educators move from data review into coordinated response. Although it integrates several kinds of information and workflows, its primary purpose remains MTSS and student-support data rather than multiple independent district operating systems.
FocalPointK12  Engaging Students & Preparing them for Success on Assessments HD

Product Details

Overview

FocalPoint is a suite of K–12 assessment, analytics, adaptive learning, and credential products. The analytics component, LENS, centralizes information from SIS, assessment, LMS, and other education systems into dashboards and predictive views; AssessCloud creates and administers standards-aligned assessments whose results feed those analyses.

Because the catalog record names the entire vendor platform, members should distinguish the products in use: LENS for data warehousing and analytics, AssessCloud for assessment, LearningTree for adaptive learning, and Backpack for credentials. The current platform supports modern 1EdTech standards and common school access services.

Product Details

Overview

GuideK12 is now Frontline Location Analytics, a K–12 geographic information and planning platform. It places SIS, student address, enrollment, boundary, building-capacity, demographic, program, staffing, parcel, and other district information on an interactive map so leaders can understand where needs and resources are located.

Districts use the platform to model attendance-boundary changes, plan for enrollment growth or decline, evaluate facilities and program placement, allocate staff and resources, support emergency response, and explain proposals to boards and communities. SchoolSearch provides a public-facing address lookup for families.

Introducing Hoonuit

Product Details

Overview

Hoonuit's education data platform became PowerSchool Unified Insights and is now represented within PowerSchool Analytics & Insights. It combines data from SIS, assessment, attendance, behavior, learning, talent, finance, and other systems into a managed longitudinal model with dashboards for district leaders, school administrators, and educators.

The platform addresses the district work behind analytics as well as the visual layer: ingesting and standardizing data, applying shared definitions and permissions, producing role-specific dashboards, and supporting analysis across student, school, program, staff, and operational outcomes. Current customers should confirm which PowerSchool Analytics & Insights modules replaced their original Hoonuit configuration.

Product Details

Overview

The Kern Integrated Data System (KiDS) is a countywide education data platform operated through the Kern Education Pledge and Kern County Superintendent of Schools. It brings nightly SIS and other district data from participating Kern County districts into shared dashboards that support student, classroom, school, district, and regional analysis.

KiDS is both technology and a collaborative service model. Its modules cover whole-student profiles, early warning and MTSS, graduation and college readiness, postsecondary outcomes, human capital, finance, and operations, while professional learning and shared governance help districts use common data across organizational boundaries.

Product Details

Overview

Microsoft Power BI is a general-purpose business intelligence platform and a core analytics workload within Microsoft Fabric. District teams can connect files, databases, cloud systems, warehouses, and APIs; transform and model data; build interactive reports; and distribute governed dashboards through Microsoft workspaces and applications.

Power BI can support instructional, enrollment, finance, HR, facilities, compliance, and public reporting, but it does not include a ready-made K–12 data warehouse or common metric definitions. District value depends on the quality of source-system integrations, semantic models, security rules, licensing, and staff or partner capacity to maintain the solution.

Product Details

Overview
Panorama Surveys & Engagement is a research-backed survey platform for collecting and analyzing feedback from students, families, teachers, and staff. Districts use it to measure school climate, belonging, relationships, engagement, safety, communication, and other factors that shape student and family experience.
Panorama can distribute multilingual, accessible family surveys and help districts identify trends and priorities, but it is not a notification or day-to-day messaging platform. It belongs under Surveys / Family Voice or Data and Analytics rather than Family Notification.

Product Details

Overview

PowerSchool Performance Matters is a K–12 assessment and instructional analytics platform. Educators create or select standards-aligned items, administer online or paper assessments, score student work, and analyze results by item, standard, class, school, subgroup, or student.

The platform can place local assessment results beside state tests, diagnostics, attendance, behavior, grades, and other measures to provide a broader view of student performance. Its primary purpose is assessment management and instructional decision-making rather than enterprise data warehousing, so it overlaps the Assessment category as much as Data and Analytics.

DecisionInsite StudentView - Quick Overview

Product Details

Overview

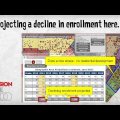
PowerSchool Predictive Enrollment Analytics, formerly DecisionInsite, is a district enrollment-forecasting and geographic planning platform. It combines current and historical enrollment, student locations, school boundaries, capacities, community demographics, and housing trends to project future enrollment and test operational scenarios.

District leaders use the product to inform budgeting, staffing, facility construction or closure, boundary changes, program placement, and board discussions. This is an operational planning system rather than a whole-student instructional dashboard, but it belongs in the analytics landscape because it converts SIS and demographic data into multiyear resource decisions.

What is Qualtrics? | The world’s first Experience Management Platform

Product Details

Overview

Qualtrics is an experience-management, survey, workflow, and feedback analytics platform. K–12 districts use it to collect and analyze student, family, employee, and community perspectives; manage forms and program evaluations; monitor school climate and engagement; and route concerns or follow-up tasks to responsible teams.

Unlike a student data warehouse, Qualtrics begins with feedback and experience data. Its dashboards, text and statistical analysis, profiles, automation, and integrations can connect those responses with operational or academic context, but districts must design instruments, sampling, identity matching, access rules, and response workflows carefully.

ReadWrite Digital Analytics

Product Details

Overview

ReadWrite Digital Analytics is a K–12 student data warehouse, reporting, and early-warning application. It combines multi-year information from SIS, assessment, attendance, grade, behavior, perception, and other systems so educators can see a whole-student view, find students crossing local risk thresholds, and monitor whether supports are working.

Analytics is paired with ReadWrite Digital Integrator, which automates collection and transformation from district source systems. Users can filter, group, pivot, chart, save, and securely share views while permissions limit each person to the students and data they are authorized to see.

Schoolytics: How to toggle between teacher and admin views

Product Details

Overview

Schoolytics is a managed K–12 data warehouse, dashboard, reporting, and student-support platform. It combines SIS, LMS, assessment, attendance, grade, behavior, survey, and other district information into role-based views for administrators, instructional coaches, counselors, teachers, students, and families.

Districts use Schoolytics to monitor strategic goals, find students needing support, analyze course and graduation pathways, track MTSS indicators, and replace recurring manual reports. The service includes automated connectors and custom data work, while districts retain access to the underlying warehouse rather than receiving dashboards as a closed black box.

Schoolzilla

Product Details

Overview

Schoolzilla is Renaissance's K–12 data warehouse and dashboard platform. It brings information from SIS, assessment, attendance, behavior, and other district systems into role-based views so leaders and educators can monitor performance, compare student groups, identify students needing support, and follow progress over time.

Schoolzilla includes managed data connections, standardized metrics, interactive dashboards, student profiles, and configurable analysis. Renaissance has also used the Schoolzilla technology in Renaissance Analytics and product-level dashboards, so districts should confirm whether their agreement is Schoolzilla Pro, Renaissance Analytics, or analytics bundled with other Renaissance products.

How Millard Public Schools Uses Tableau

Product Details

Overview

Tableau is a general-purpose business intelligence and data-visualization platform from Salesforce. District analysts can connect databases, cloud services, files, and prepared data warehouses; build interactive reports and dashboards; and publish governed views for administrators, departments, schools, or public audiences.

Tableau does not provide a K–12 data model, SIS integration, or education metrics by itself. Its value depends on the district's data warehouse, connector architecture, metric definitions, security model, and staff capacity. It is most useful when a district already has reliable data engineering and needs flexible exploration and presentation across instructional and operational domains.

21 results - showing 1 - 20
1 2